
Increased human population near the coast and associated impacts on these environments are leading to worldwide loss of coastal habitat. These human-derived stressors have resulted in substantial loss of coastal habitats, including seagrass, salt marsh, mangrove, coral, and tropical forest. Losses occur due to land reclamation, development, excess sediment or nutrients finding their way into the water supply, overfishing, damage by boats and fishing gear, logging, competition from invasive species, some aquaculture, and climate change, including sea level rise and warming that makes some regions uninhabitable for certain habitat-forming species like coral. These habitats provide inherent value to humans, which can be quantified and is normally referred to as ecosystem services. Seagrasses, salt marsh, mangrove, and coral reefs all have high value in terms of ecosystem services- that is, they serve an important function for humanity.

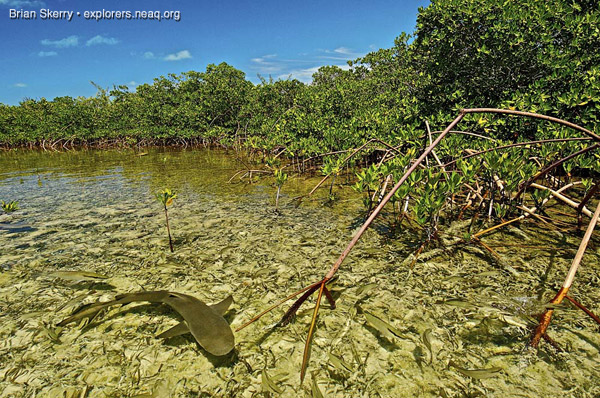
What do these services look like? One major service provided by coastal habitats includes protection from storms. Damages from storms like hurricane Katrina are exacerbated by the loss of salt marsh, which slow approaching waves and help mitigate flooding. Another valuable service complex habitats provide is protection of sensitive early life stages of a variety of commercially and recreationally important fish and shellfish species. These habitats act as a nursery for many species because the structural complexity they provide protects young fish from predators. Some habitats, such as coral, function as the main driver of coastal tourism in many regions. This ecosystem service brings revenue to coastal communities. As corals and other coastal habitats are lost to stressors like climate change, so too are many other species that depend on them for structure. Thus habitat loss is generally also associated with loss in species diversity.

In fact, in the 2016 Living Planet Report predicts that the top threats for global biodiversity of vertebrates are habitat and overexploitation. This study pulls together data from more than 3,000 short-term and long-term monitoring project which together track the status of 14,152 populations of some 3,700 vertebrate species. Other major threats to diversity include pollution, invasive species, disease, and climate change.
Overall it appears the cumulative effect of the stressors I’ve mentioned to this point has been a decline in species globally. There is a clear trend of declining diversity that appears to be accelerating. These are species that, while still present in the background, no longer contribute to their community the same way they once did.


The consequence of this is a loss of function, impairing the ocean’s ability to provide food, maintain water quality, and recover from disturbance. Loss in species diversity means decreased fisheries production, deceases in nursery habitat, and loss of filtration in coastal systems. The consequences of these lost ecosystem services include increases in events that harm people and their livelihoods, such as beach closures, harmful algae blooms, fish kills, fishery closures, low oxygen, floods, and invasive species. Overall, systems with high species diversity are more stable and provide more ecosystem services.

The Chesapeake Bay is no stranger to habitat loss. The dominant seagrass in Chesapeake Bay, eelgrass Zostera marina, plays an important role as nursery habitat for a variety of economically and ecologically important species in the Bay, including the blue crab. The abundance of seagrass has fluctuated over the last 100 years due to a disease outbreak in the 1930s, subsequent recovery until the 1960s, and dramatic declines post 1972, when tropical storm Agnes wiped out half of the population of eelgrass in the Bay. This was largely due to fresh water influx from heavy precipitation, and increased sediment loading from flooding, which buried beds. Eelgrass in Chesapeake Bay has never recovered from Agnes, and its range in the Bay has been drastically reduced. More recently, since 1991, eelgrass has declined 29%. This is largely due to poor water quality, from nutrient pollution and coastal development, which decreases water clarity and makes it hard for seagrass to photosynthesize, resulting in a 50% loss of deep water beds. The situation in shallow beds is exacerbated by rising temperatures, which is a source of stress for this species, which is at the southern end of its range in the Bay.

Oyster reef habitat has also declined in the Chesapeake Bay drastically, with a 50-fold decrease since 1900. The decline began with the advent of more efficient fishing technology, indicating the decrease in oysters is due to overfishing and habitat loss, which go hand in hand for this species, since oysters live on other oysters. With the loss of oysters, a major source of shell was also lost, as oyster shell is a limited and non-renewable resource, and shells dissolve in seawater given enough time. This shell would have provided an important structure for attachment in a system otherwise characterized by soft sediments. So between seagrass loss and oyster reef decline, the Bay is experiencing substantial reduction in complex habitat.
One group of species that may be impacted by habitat loss in Chesapeake Bay is bivalves. Bivalves serve many important roles in coastal systems like Chesapeake Bay. They are key prey resources for a variety of economically and ecologically important species, like blue crabs. Their capacity to filter feed contributes to the water quality of the Bay, as demonstrated in this photo of two tanks, one with oysters, which has clear water, and one without, which has murky water. Through filter feeding, and serving as a food resource for finfish, bivalves connect the food webs and nutrient cycles at the sea floor with those in the water column. And of course, bivalves support profitable fisheries in the Bay and in other coastal regions. In Chesapeake Bay, oysters and hard clams are the focus of aquaculture, and wild fisheries still exist for soft-shell clam and razor clams, which are mainly harvested as bait.

Bivalves in Chesapeake Bay are highly diverse. Not all bivalves serve the same role. To illustrate this, perhaps it is best to look at two common species, soft-shell clam Mya arenaria, and Gemma gemma. Mya are several cm in shell height, and can be biomass dominants where they are locally abundant, while Gemma gemma max out at only a few mm, and are often hard to distinguish from grains of sand.
How do we calculate the diversity of roles bivalves play in the Chesapeake Bay? We can caluculate something called functional diversity. Functional diversity goes further than quantifying number of species, and instead attempts to capture the roles that are filled by various species groups. Functional diversity operates on the premise that not all species are equally distinct. For instance, take these two photos.

Both communities have just four rocky intertidal species. However, it may seem as though the community on the right is more diverse, because the animals represented are more different from each other than the animals on the left. In fact, the community on the left has three species of barnacle. While different barnacle species can look very different, they are likely all serving similar roles. The community on the right has species from different phyla, and even different kingdoms, that likely serve very different roles. Functional diversity metrics are based on functional traits: that is any measurable aspect of an organisms that reflects what it actually does, and how it interacts with its surroundings.
Bivalves interact with their environments in a variety of different ways. Certain predators may or may not be able to eat them, depending on their defenses. Furthermore, bivalves themselves have different feeding modes. Thus, feeding mode is one of the traits that define how bivalves interact with their environment. Bivalve living position also serves as a functional trait. Bivalves that are on the sediment surface, such as the mussel, are easily encountered by predators, while deep-burrowing bivalves remain undetected. These three traits, based on a bivalve’s role in the food web, describe a bivalve’s function much better than taxonomic definition of species.

Once functional traits are identified, there are a variety of ways to calculate functional diversity. For two continuous traits, such as shell thickness and burial depth, you can imagine mapping out each bivalve on those two axes, and calculating the distance between each. Some indices use this graph to calculate things like the maximum area between all species as a metric of functional diversity. Others will take the distances between species and create a matrix of pairwise distances like the one here, and calculate functional diversity as the average or sum of distances. Others still will create a phenogram showing the relationships between species according the traits. Functional diversity is then calculated as a function of number of individuals in each of these categories, A B C and D, using common diversity indices like the Simpson’s index. Functional richness can also be calculated as the number of functional groups in a sample or area.

In a recent study published by myself and colleagues, we calculated functional diversity of bivalves in the Chesapeake Bay using the phenogram approach. We sorted all bivalve species into one of four groups, based on presence of an armored shell, feeding mode, and living position. These groups were deposit feeders (DF, meaning bivalves that extract nutrients from sediment), deep-burrowing and suspension (or filter) feeding bivalves (DBSF), thin-shelled and surface dwelling bivalves (TSSD), and armored bivalves (ARM). We then calculated diversity using these functional groupings, rather than individual species.
We used this measure of functional diversity of explore how habitat is related to function in bivalves. We noticed that each unique habitat in the Chesapeake Bay supported a different bivalve functional group. Deposit feeding bivalves were associated with mud, possibly because this was a good food source for them. Armored bivalves were associated with oyster shell, likely because the hard shell material provides a surface for attachment for mussels, a common armored species in Chesapeake Bay. Finally, thin-shelled and surface-dwelling bivalves were strongly associated with seagrass habitats. It is likely the roots and blades of seagrass provide vulnerable species with needed protection from predators. It appears that all habitats play a roll in maximizing functional diversity in Chesapeake Bay. This means habitat loss may lead to the loss of entire functional groups of bivalves in the Bay, with consequences for ecosystem function.


It’s not all bad news- recently seagrass in particular appears to be recovering in the coastal bays of Virginia and in some locations in Chesapeake Bay. This may bode well for ecosystem function in the Chesapeake Bay. However, out understanding of habitat and ecosystem function means persistent action to maintain healthy growth of seagrass, and maintenance of all habitats in the Bay, is necessary to maintain the natural resources for future generations.
References
Duarte, C.M., Dennison, W.C., Orth, R.J.W., and Carruthers, T.J.B. 2008. The charisma of coastal ecosystems: Addressing the imbalance. Estuaries and Coasts 31:233-238.
Glaspie, C.N., and Seitz, R.D. 2017. Role of habitat and predators in maintaining functional diversity of estuarine bivalves. Marine Ecology Progress Series 570:113-125. http://dx.doi.org/10.3354/meps12103 [download]
Lefcheck, J.S., Wilcox, D.J., Murphy, R.R., Marion, S.R., and Orth, R.J. 2017. Multiple stressors threaten the imperiled coastal foundation species eelgrass (Zostera marina) in Chesapeake Bay, USA. Global Change Biology. 23(9):3474-3483.
Orth, R.J., Denison, W.C., Lefcheck, J.S., Gurbisz, C., Hannam, M., Keisman, J., Landry, J.B., Moore, K.A., Murphy, R.R., Patrick, C.J., Testa, J., Weller, D.E., and Wilcox, D.J. 2017. Submersed aquatic vegetation in Chesapeake Bay: Sentinel species in a changing world. BioScience 67(8):698-712.
Petchey, O.L. and Gaston, K.L. 2006. Functional diversity: Back to basics and looking forward. Ecology Letters 9:741-758.
Worm, B., Barbier, E.B., Beaumont, N., Duffy, J.E., Folke, C., Halpern, B.S., Jackson, J.B.C., Lotze, H.K., Micheli, F., Palumbi, S.R., Sala, E., Selkoe, K.A., Stchowicz, J.J., and Watson, R. 2006. Impacts of biodiversity loss on ocean ecosystem services. Science 314:787-790.
WWF. 2016. Living Planet Report 2016. Risk and resilience in a new era.
WWF International, Gland, Switzerland.